
5 Simple KPIs to Track the Health of Your Operations
When you’re running a small business, it’s easy to manage by “vibes”: you feel busy, money is coming in, and you assume things are fine. But “busy” and “healthy” are not the same thing. Owners who rely only on gut feeling usually notice problems late when cash is tight, customers are annoyed, or the team is overwhelmed.
You don’t need a 30‑metric dashboard to stay in control. Most small businesses can get a very clear picture of operational health with five simple KPIs they review once a month. These numbers are easy to calculate, don’t require special software, and give you early warning when systems are under strain.
KPI 1 – On‑Time Delivery Rate
What it is: The percentage of work (orders, projects, services) you deliver on or before the promised date. It’s a direct read on how reliable your operations are.
Why it matters for small businesses:
If you’re always scrambling to hit deadlines, it usually means processes aren’t clear, work isn’t planned realistically, or you’re overpromising. Customers might not complain every time, but they notice patterns. A falling on‑time rate is an early sign that you’re growing faster than your systems.
How to calculate (monthly):
Count how many jobs you delivered that month.
Count how many of those were on or before the promised date.
Divide and multiply by 100.
What “good” looks like: Aim for 90%+ delivered on time for most service businesses. If you’re below 80%, you’ve likely got process or capacity issues to fix.
On‑time delivery rate
The percentage of jobs, orders, or projects you deliver on or before the date you promised.
Count all completed jobs this month, then how many were on or before the agreed date.
KPI 2 – Cycle Time (From Request to Done)
What it is: The average time it takes from when a customer makes a request (enquiry, order, brief) to when you deliver the final result. This is your end‑to‑end process speed.
Why it matters:
Cycle time tells you how quickly your business turns demand into value. Long cycle times mean work is getting stuck—often in handovers, waiting for approvals, or when everything depends on you personally. Shortening cycle time without burning people out is one of the fastest ways to improve cash flow and customer happiness.
How to calculate (monthly):
For each job, note when it started and when it finished.
Convert that into days.
Add all the days and divide by the number of jobs.
What “good” looks like: There’s no universal number, but you want cycle time trending down or stable as you grow. If volume is up and cycle time is rising sharply, your operations are under stress.
Average cycle time
How long it takes, on average, to go from client request to finished work.
Use calendar days between when work starts and when it is finished for each job, then take the average.
KPI 3 – First‑Time Right Rate (Error/Rework Rate)
What it is: The percentage of work you complete correctly the first time, without needing rework, corrections, or redoing steps.
Why it matters:
Every time you redo work, you lose capacity and margin. For small teams, rework is expensive: it steals time from new work and burns people out. First‑time right (also called first pass yield) is a simple way to measure quality and how well your processes are set up.
How to calculate (monthly):
Define “rework” for your business (e.g. any job where the client asks for unscheduled fixes; any internal redo due to mistakes).
Count how many jobs were done without rework.
Divide by total jobs and multiply by 100.
What “good” looks like:
For many service businesses, 85–95% first‑time right is realistic. If you’re below 80%, you likely need clearer intake, better checklists, or improved training.
First‑time right rate
The percentage of jobs you complete correctly the first time, with no rework or corrections.
Decide what counts as “rework” (e.g. client corrections, internal fixes due to errors) and apply that definition consistently.
KPI 4 – Work in Progress (WIP)
What it is: The number of jobs that have started but are not yet finished. It is a simple count of “half‑done work” sitting in your system at any point.
Why it matters:
Too much WIP is a classic sign of overload. When everything is started and nothing is finished, your cycle times go up, your team feels constantly behind, and cash is delayed. Owners often feel busy but don’t see output; WIP makes this visible.
How to track:
At least once a week, count how many jobs are in progress (not yet delivered).
Track this number over time and note your average WIP per week/month.
You don’t even need a formula: just a simple line in a sheet where you record the date and how many items are currently in progress.
What “good” looks like:
You want WIP to be stable or controlled, not rising without limit. If WIP keeps increasing week after week, you’re starting more work than you can finish—time to limit new starts or change capacity.
Work in progress (WIP)
The number of jobs that have started but are not yet finished on a given day.
Once a week, count everything that’s started but not done yet and track that number over time to see if it’s stable or constantly rising.
KPI 5 – Revenue per FTE (Operational Productivity)
What it is: Revenue per full‑time equivalent (FTE) is a simple proxy for how much value each person in your business is generating. It’s a classic small‑business productivity metric.
Why it matters:
You don’t need a fancy productivity tool to see if your operations are efficient. If revenue per FTE is rising while quality stays stable, your systems are working. If it’s flat or falling despite growth, something in your operations is holding you back.
How to calculate (monthly or yearly):
Count yourself and your team (e.g. two half‑timers = 1 FTE).
Use monthly or annual revenue.
Divide revenue by FTE.
What “good” looks like:
Healthy ranges vary by industry, but the key is trend: revenue per FTE should improve as you tighten processes, delegate better, and automate low‑value tasks.
Revenue per FTE
How much revenue your business generates per full‑time equivalent (FTE) person.
Two half‑timers count as 1 FTE. Track this monthly or yearly and watch whether it’s trending up as you improve your operations.
Putting it together: a one‑page operations health sheet
You can track all five KPIs on a single page or simple spreadsheet. Many small‑business KPI guides recommend limiting yourself to 5–10 metrics and reviewing them monthly, rather than collecting dozens of numbers you never use.
A simple monthly table might look like this:
One‑page operations health sheet (mock data)
Here’s how six months of numbers might look for a small service business that is improving its processes and delegation over time.
| Month | On‑time delivery (%) | Avg cycle time (days) | First‑time right (%) | WIP (end of month) | Revenue per FTE (€) |
|---|---|---|---|---|---|
| Jan | 78 | 14 | 82 | 19 | 4,500 |
| Feb | 81 | 13 | 84 | 18 | 4,800 |
| Mar | 85 | 12 | 86 | 16 | 5,100 |
| Apr | 88 | 11 | 89 | 15 | 5,400 |
| May | 91 | 10 | 91 | 14 | 5,700 |
| Jun | 93 | 9 | 93 | 13 | 6,000 |
What this example shows: on‑time delivery and first‑time right are climbing, while cycle time and WIP are slowly dropping. At the same time, revenue per FTE is increasing, suggesting that operations are getting both more reliable and more productive.
Your actual numbers will look different, but the goal is the same: a simple snapshot that tells you whether your operations are getting healthier month by month.
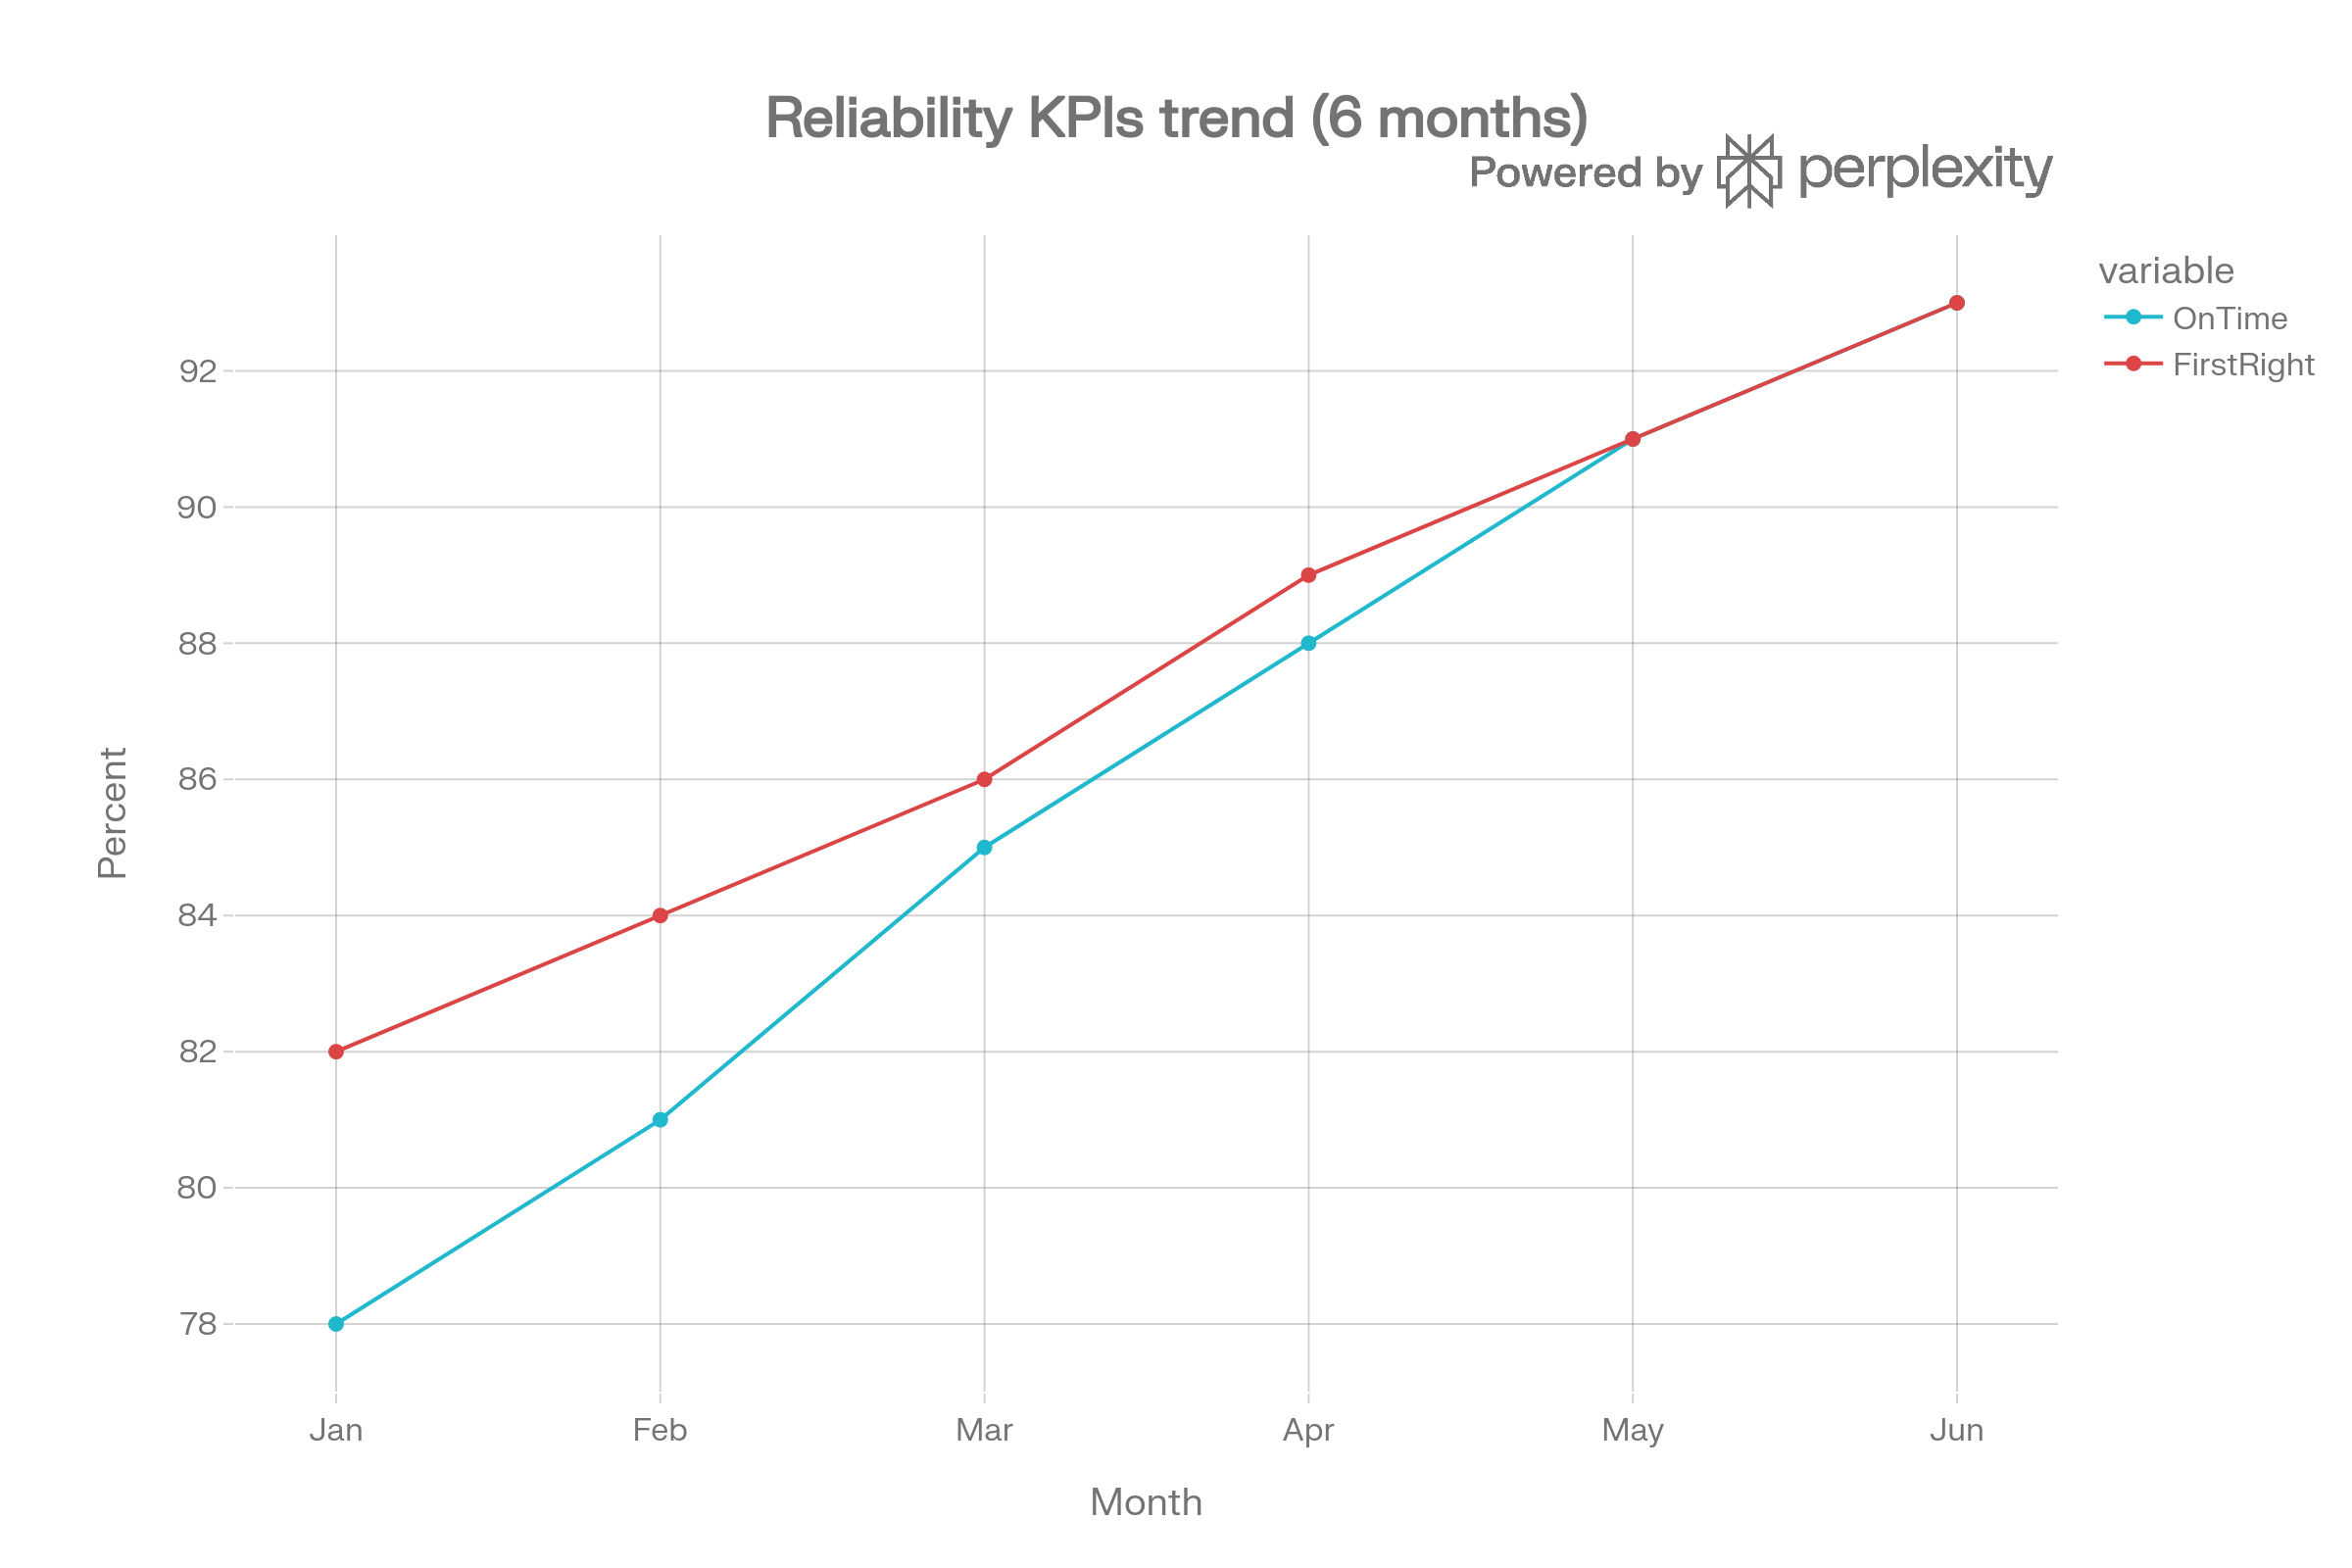
Ops Reliability Trend
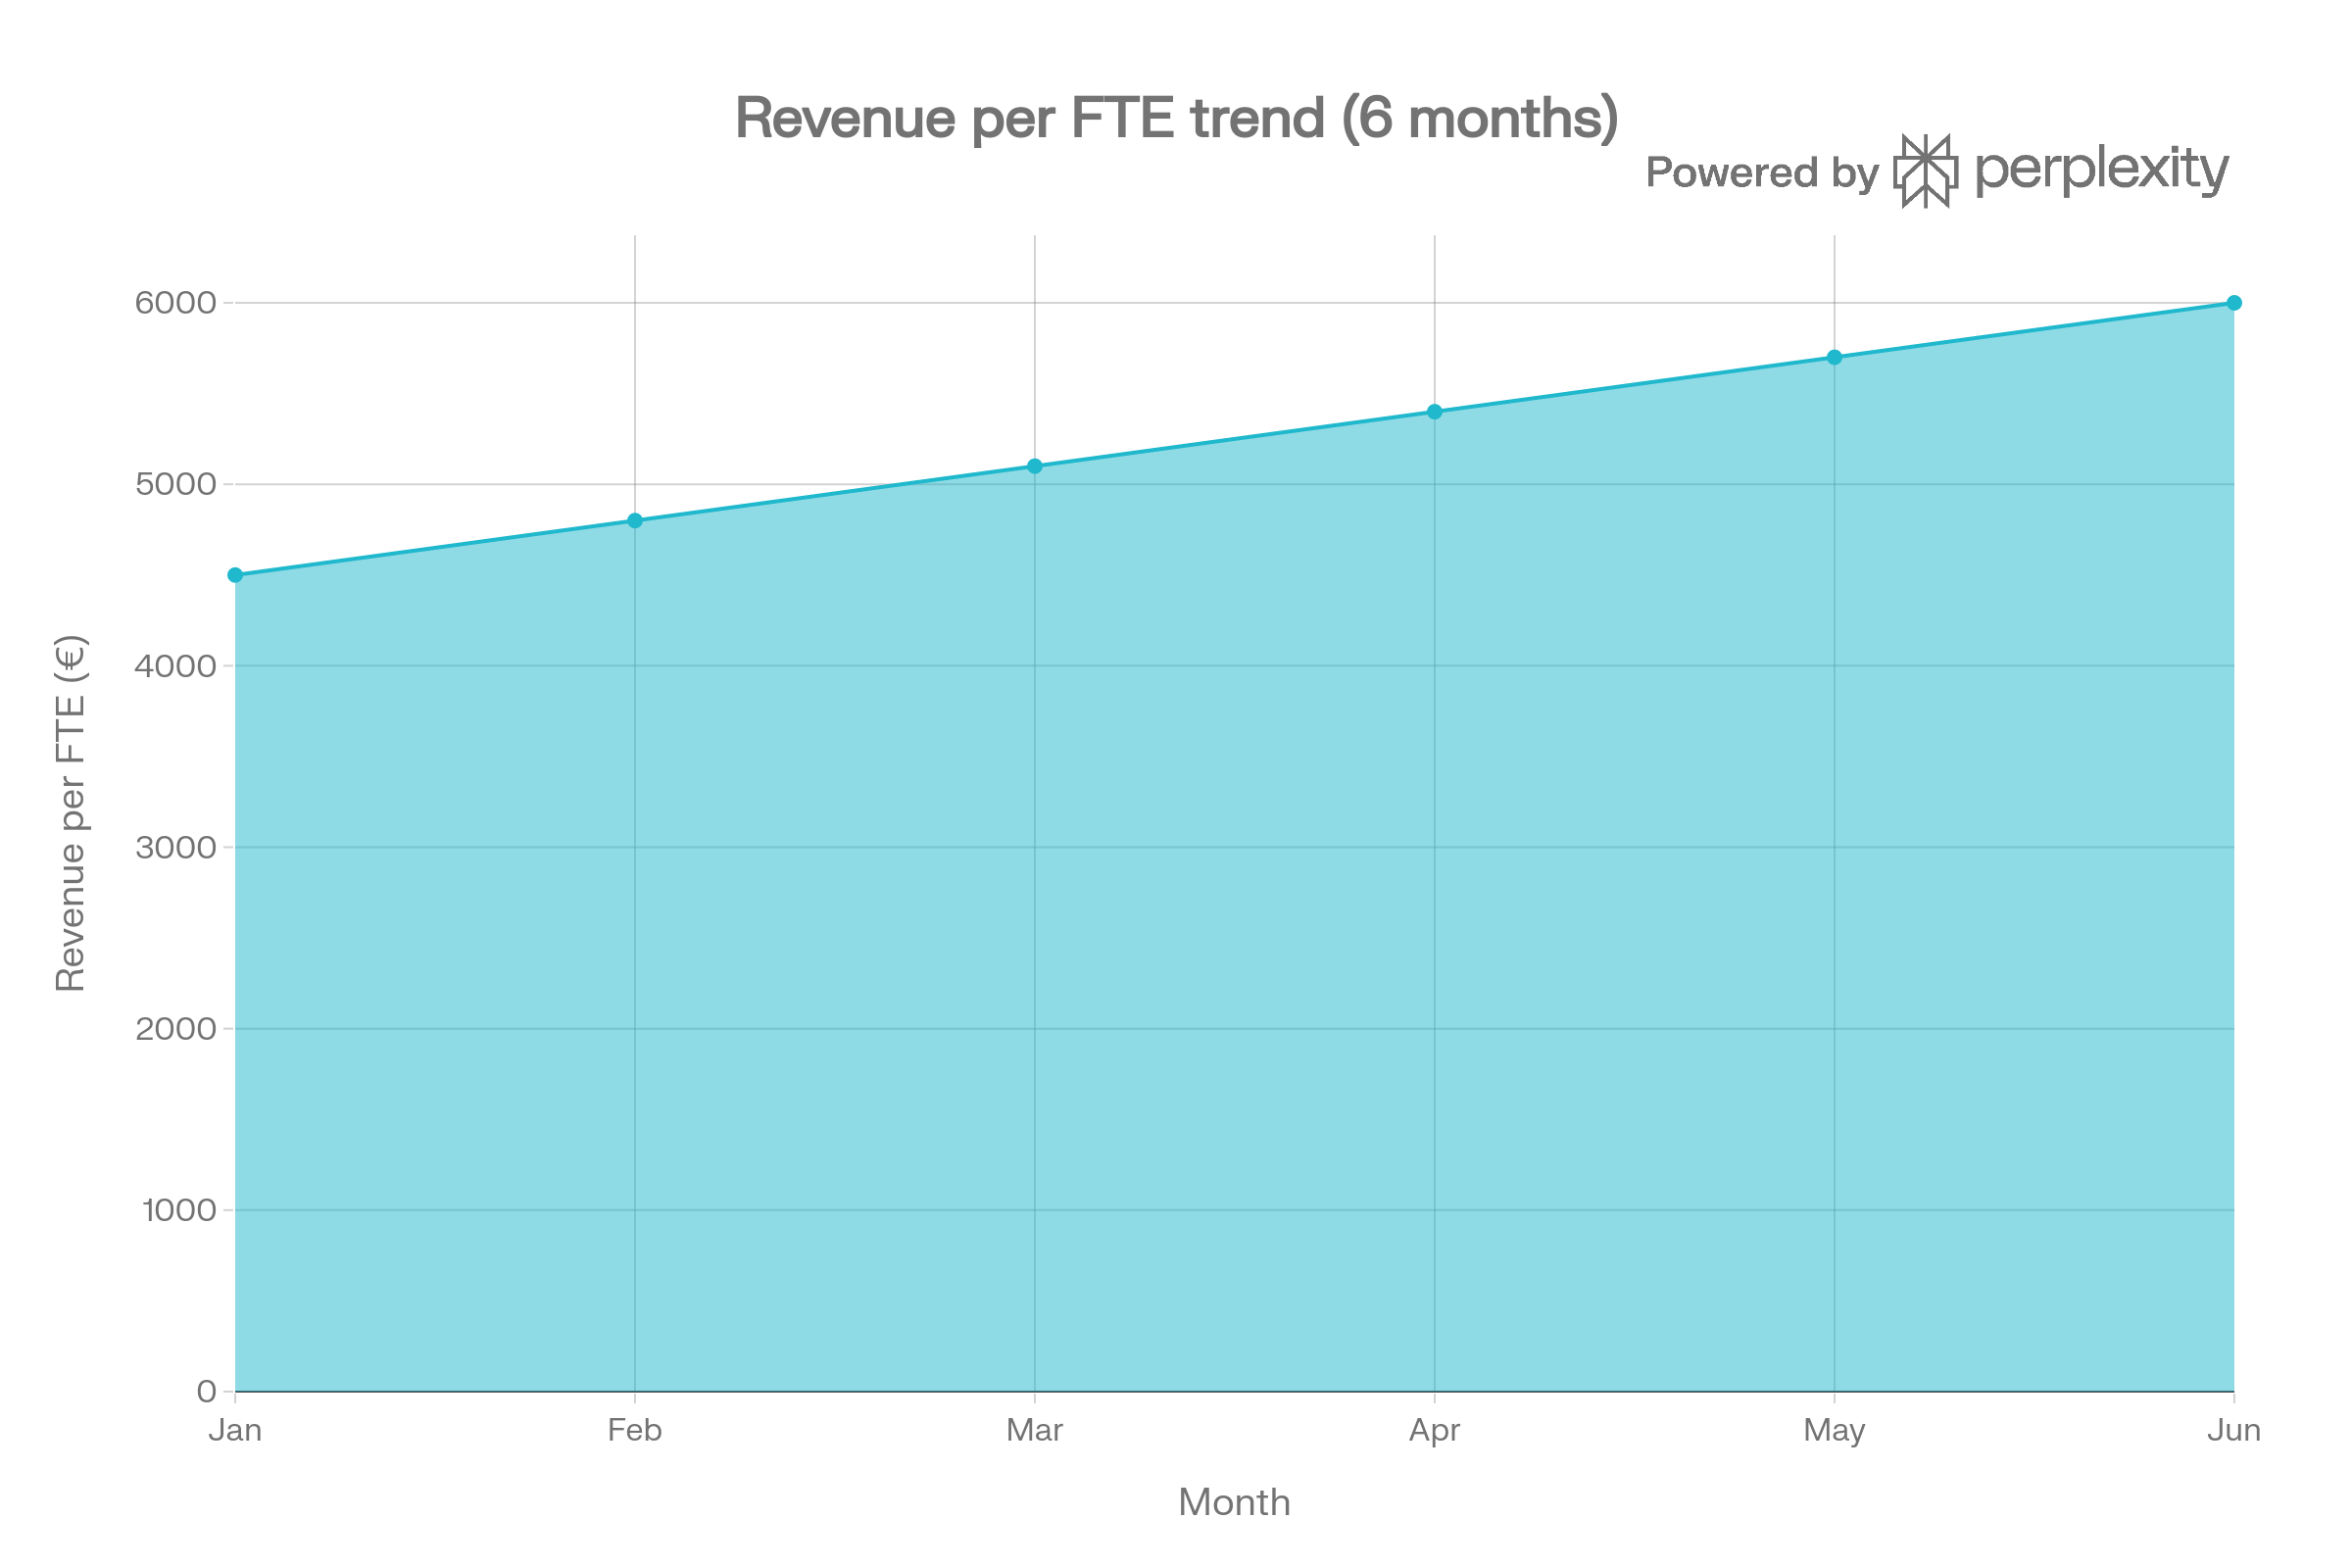
Ops Rev Fte Trend
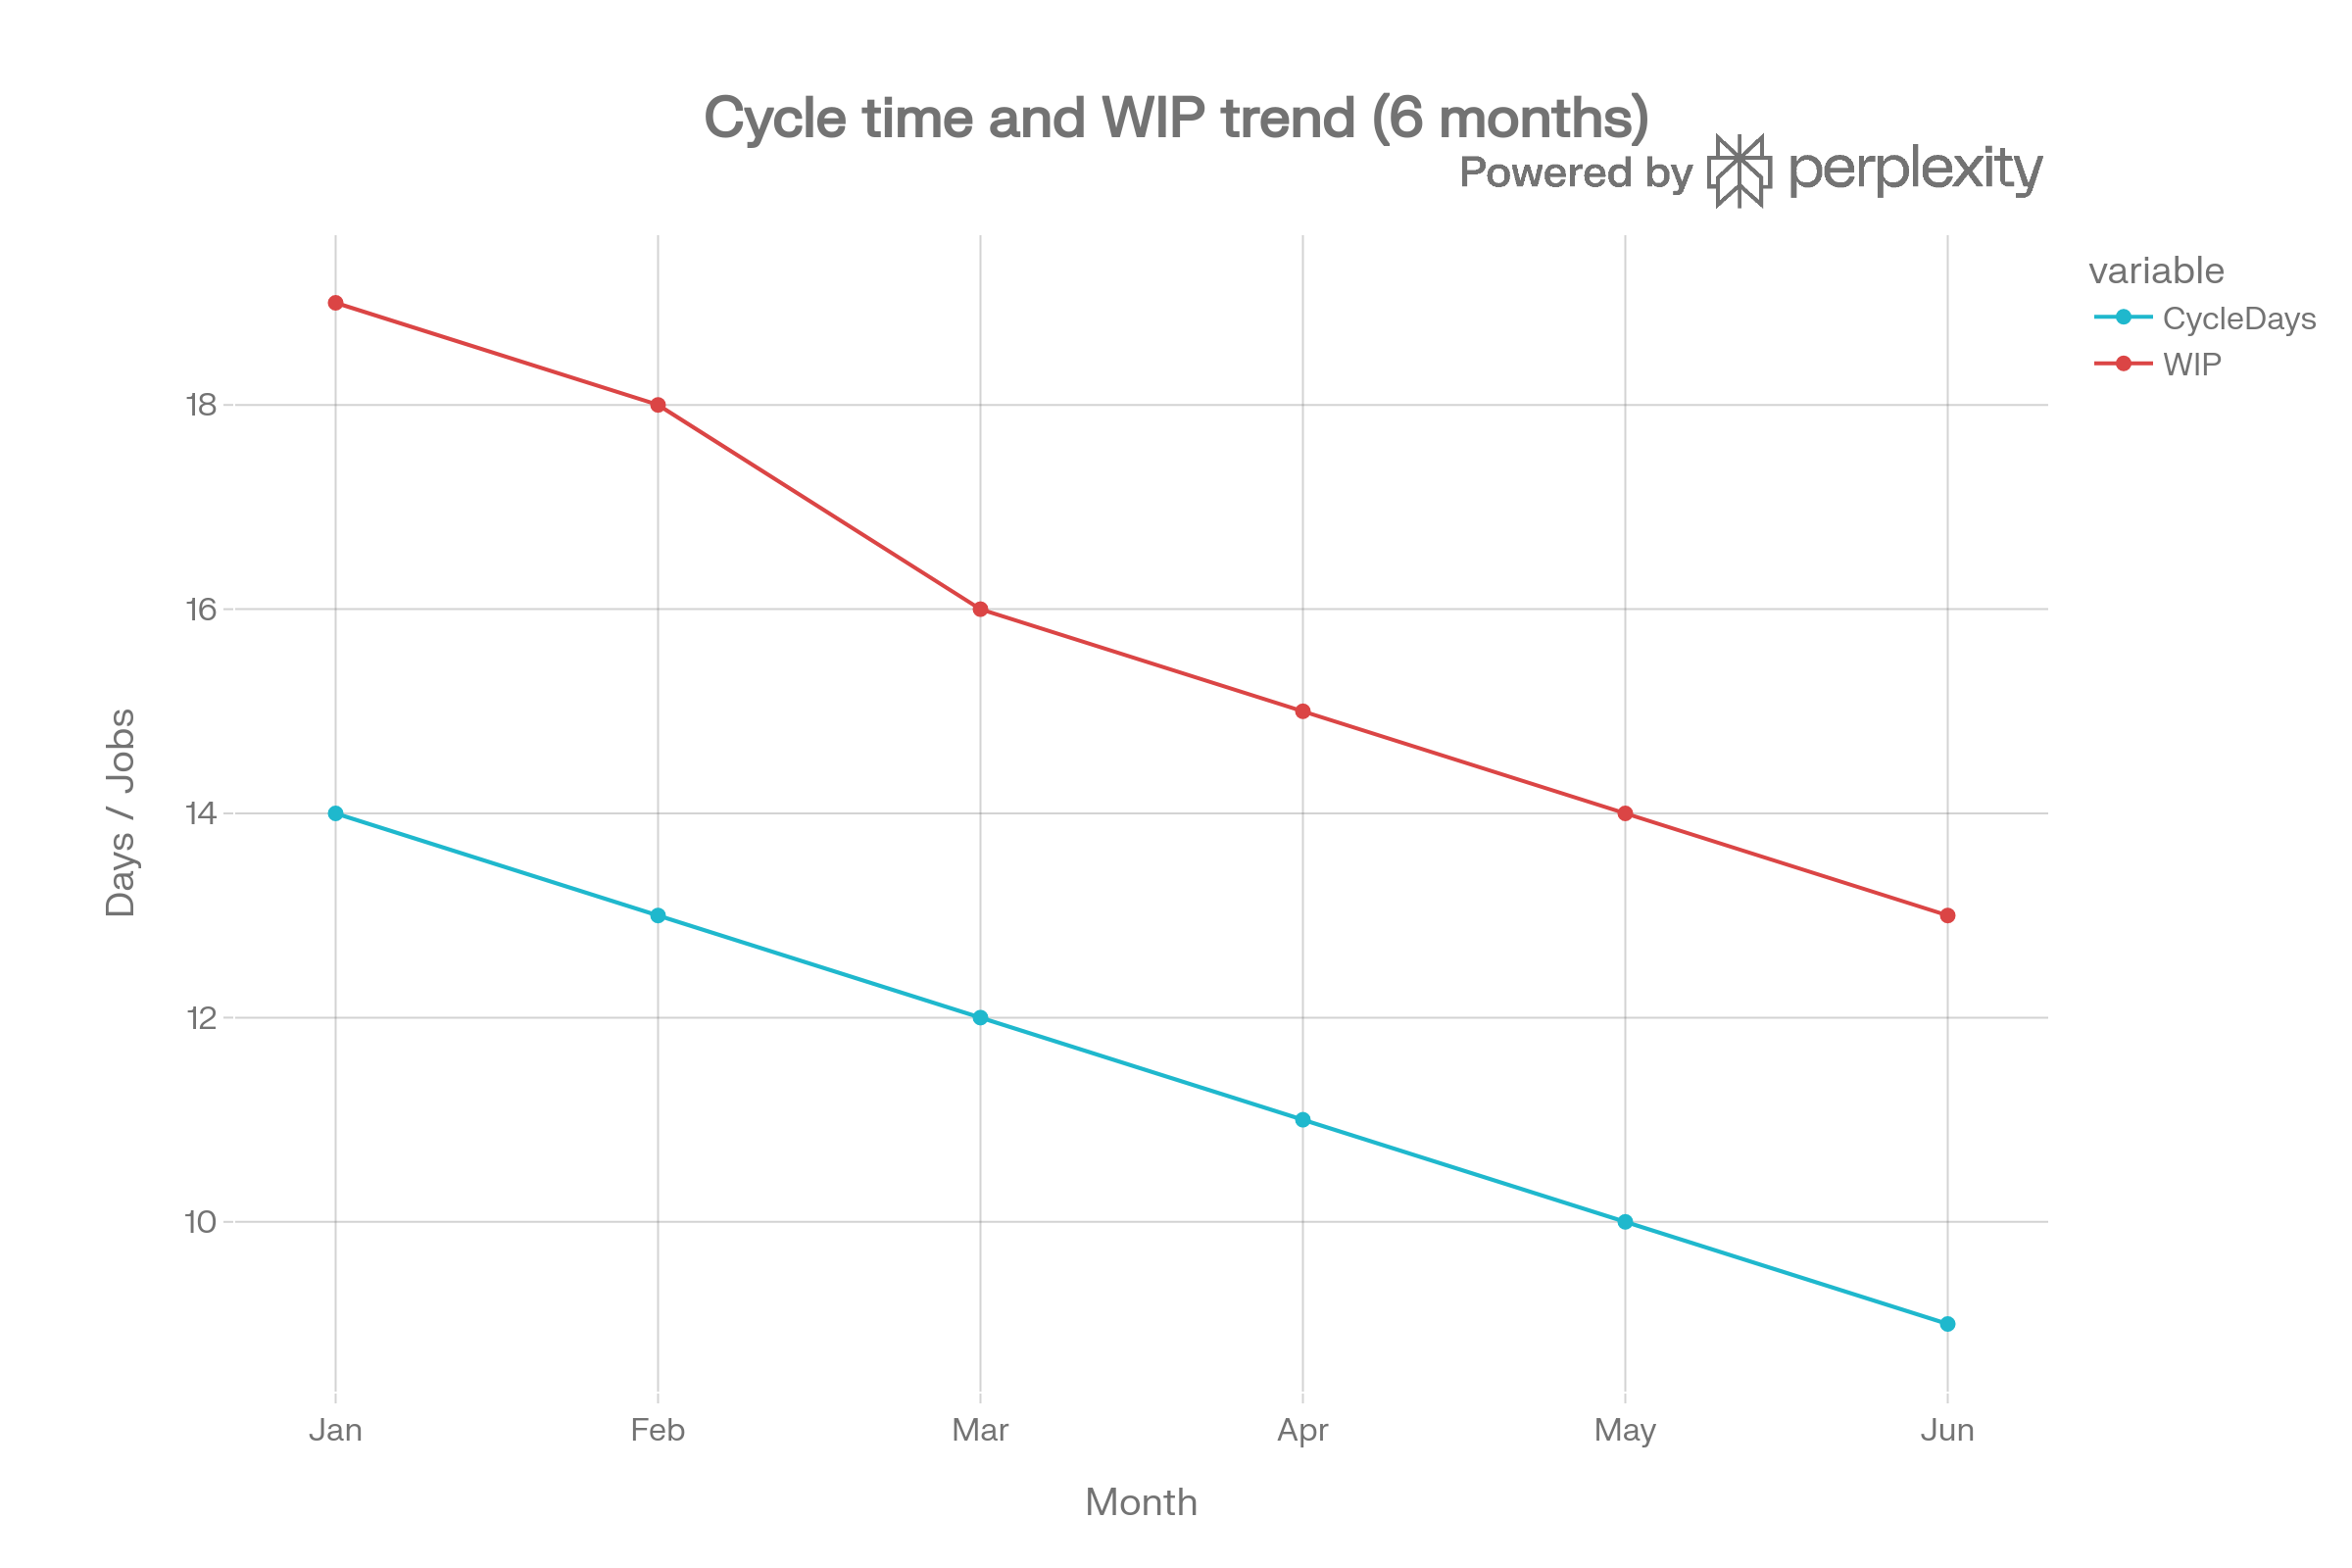
Ops Speed Wip Trend
These three charts show whether your operations are getting healthier month by month. The reliability chart (on‑time delivery and first‑time right) should trend upwards or stay high—drops here are early warning signs that your systems or capacity are under strain. The speed and workload chart (cycle time and WIP) should gently move in the opposite direction: cycle time and the number of jobs in progress ideally fall or stay controlled as you streamline work. Finally, the revenue per FTE chart should climb over time if your team is becoming more productive; if that line is flat or falling while the others worsen, you’re likely growing on shaky operational foundations rather than solid systems.
During your monthly review, ask the same three questions for each metric:
What changed compared to last month?
Why did it change? (what did we do differently?)
What will we do next? (small, concrete actions).
Over a few months, these five KPIs will show whether your operations are getting more reliable, faster, and more profitable—or whether you’re growing on shaky foundations.
You don’t need a complex dashboard to run a healthier business, just a handful of numbers you look at consistently. These five KPIs give you a clear view of reliability, speed, quality, workload, and productivity without drowning you in data. When you track them month by month, patterns emerge quickly: you see where operations are working, where they’re under strain, and where small changes could make a big difference.
The real value isn’t in the spreadsheet, it’s in the conversation these numbers start. Each month, you can ask: what changed, why, and what are we going to do differently next month? Over time, that simple habit turns your operations from something you react to into something you deliberately design. If you’d like support setting up your own one‑page health sheet and reading what it’s telling you about your business, Hili Consulting can help you turn these KPIs into practical decisions, not just nice charts.